In the realm of stock market analysis, there exists a vast array of indicators and metrics that investors and traders alike use to gauge market sentiment and potential price movements. Among these many indicators, one volume indicator stands out as a critical tool for assessing the strength and direction of market trends. Known as the On-Balance Volume (OBV), this indicator offers valuable insights into the relationship between price movements and trading volume, making it a powerful ally for those seeking to navigate the complexities of the stock market.
What sets OBV apart from other volume indicators is its ability to combine both price and volume data into a single, easy-to-read chart. By tracking the cumulative volume flow based on whether a security’s price closes higher or lower than the previous day, OBV effectively captures the buying and selling pressures at play in the market. In essence, OBV helps investors discern whether the volume is predominantly flowing in during up days (indicating buying pressure) or out during down days (indicating selling pressure), providing crucial insights into market dynamics.
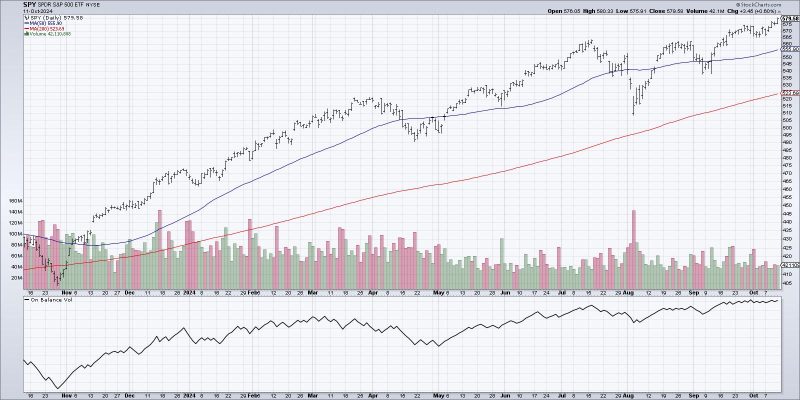
One of the key strengths of OBV is its capacity to lead price movements. As the indicator is based on the volume accompanying price changes, it can often signal potential price reversals or continuations before they are reflected in the price itself. This predictive quality allows traders to anticipate market shifts and adjust their strategies accordingly, potentially gaining an edge in their trading activities. By identifying divergences between OBV and the price of a security, traders can pinpoint potential entry or exit points, enhancing their decision-making process.
Moreover, OBV can also be used to confirm the validity of price trends. When the indicator aligns with the direction of the price movement, it provides additional validation of the trend’s strength. A rising OBV alongside an uptrending price suggests that the buying pressure is supporting the price increase, reinforcing the bullish outlook. Conversely, a declining OBV in conjunction with a downtrending price indicates that selling pressure is driving the price down, reinforcing the bearish sentiment.
In conclusion, the On-Balance Volume indicator holds a unique position in the toolkit of technical analysts and traders due to its ability to blend volume data with price action, offering valuable insights into market trends and potential reversals. By monitoring the interactions between OBV and price movements, investors can enhance their decision-making processes, identify optimal entry and exit points, and gain a deeper understanding of market dynamics. In a landscape characterized by uncertainty and volatility, having a reliable indicator like OBV at one’s disposal can provide a crucial edge in navigating the complexities of the stock market.


