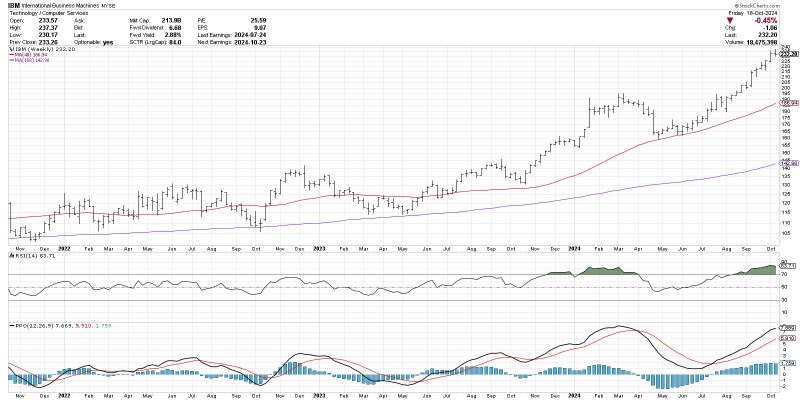
The Moving Average Convergence Divergence (MACD) histogram is a popular technical analysis tool used by traders to identify potential trend changes in financial markets. Developed by Gerald Appel, the MACD histogram is derived from the MACD line (the difference between a short-term exponential moving average and a long-term exponential moving average) and the signal line (a nine-period exponential moving average of the MACD line). By focusing on the MACD histogram, traders can potentially gain insights into shifts in market sentiment and momentum.
One key advantage of the MACD histogram is its ability to provide early signals of trend changes. As the histogram is plotted as bars above or below the zero line, it visually represents the difference between the MACD line and the signal line. When the histogram moves above the zero line, it indicates that the short-term moving average is crossing above the long-term moving average, suggesting a potential bullish trend change. Conversely, a histogram that moves below the zero line might signal a bearish trend change.
Traders often look for specific patterns in the MACD histogram to anticipate trend changes. For example, a bullish trend reversal might be anticipated when the histogram forms higher lows while the price is forming lower lows, indicating potential bullish divergence. On the other hand, bearish divergence might be identified when the histogram forms lower highs while the price is forming higher highs, signaling a potential bearish trend reversal.
It is important to note that while the MACD histogram can be a valuable tool in identifying potential trend changes, it is not infallible and should be used in conjunction with other technical indicators and analysis methods. As with any trading tool, false signals can occur, and it is crucial for traders to exercise proper risk management and combine multiple sources of information to make well-informed trading decisions.
In conclusion, the MACD histogram holds the potential to offer valuable insights into anticipating trend changes in financial markets. Traders who incorporate this tool into their technical analysis arsenal may benefit from early signals of potential trend reversals. By understanding how to interpret the MACD histogram and recognizing key patterns, traders can enhance their ability to make informed trading decisions and navigate changing market conditions effectively.


