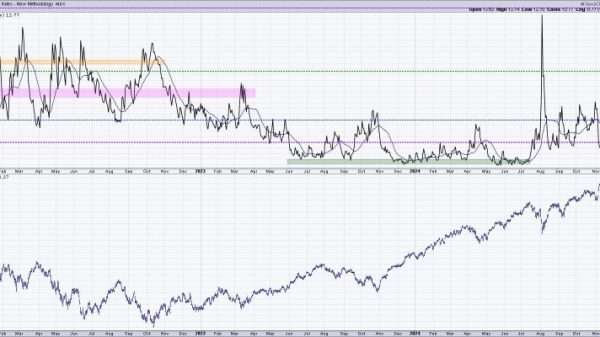
Analyzing stock charts is a crucial aspect of making informed investment decisions in the stock market. With the rapid advancements in technology, there are various tools available to aid investors in analyzing stock charts effectively. In this article, we will discuss five must-have tools for analyzing stock charts.
1. **Moving Averages**: Moving averages are one of the fundamental tools used in technical analysis. They help investors identify trends and potential reversal points in stock prices. By calculating the average price of a security over a specific time period, moving averages smooth out price fluctuations, making it easier to spot trends. Traders often use moving averages such as the 50-day and 200-day moving averages to assess the long-term and short-term trend direction of a stock.
2. **Relative Strength Index (RSI)**: The Relative Strength Index is a momentum oscillator that measures the speed and change of price movements. This tool helps investors determine whether a stock is overbought or oversold, signaling potential trend reversals. The RSI is plotted on a scale of 0 to 100 and is commonly used to confirm the strength of a trend. A reading above 70 indicates an overbought condition, while a reading below 30 suggests an oversold condition.
3. **Volume Analysis**: Volume is a crucial indicator that provides insight into the strength and legitimacy of a price movement. Analyzing volume patterns can help investors confirm the validity of a price trend. Increasing volume during an uptrend indicates strong buying pressure, while decreasing volume during a rally could signal a potential reversal. Tools like volume bars and volume moving averages can assist investors in interpreting volume patterns effectively.
4. **Support and Resistance Levels**: Support and resistance levels are key price levels at which a stock tends to bounce or reverse direction. Identifying these levels can help investors make informed decisions about entry and exit points. Tools such as trendlines, horizontal lines, and pivot points can be used to draw support and resistance levels on stock charts. By paying attention to how the price reacts at these levels, investors can gauge the strength of a trend and anticipate potential price movements.
5. **Candlestick Patterns**: Candlestick patterns are visual representations of price movements that help investors predict potential market reversals and continuations. Patterns such as doji, hammer, engulfing, and evening star provide valuable insights into market sentiment and price action. By recognizing these patterns on stock charts, investors can make informed decisions about when to buy, sell, or hold a stock.
In conclusion, having the right tools for analyzing stock charts is essential for successful trading and investing in the stock market. By utilizing moving averages, the Relative Strength Index, volume analysis, support and resistance levels, and candlestick patterns, investors can gain a comprehensive understanding of market trends and make informed decisions. Incorporating these tools into your technical analysis toolbox can enhance your ability to identify profitable trading opportunities and manage investment risks effectively.


